Chloropleth map
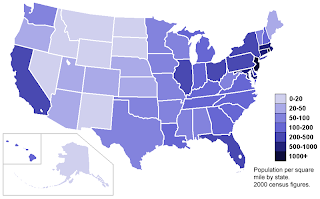
A chloropeth map is a thematic map in which certain areas are distinctly colored or shaded to represent classed values of a particular phenomenon. They can be used if the data is attached to enumeration units, standardized to show rates or ratios, and there is a continuous statistical surface.
Isarithmic Map

Isarithmic maps represent continuous data by a range of continuous color/value or related classes of color. The data must be continuous or contain data for any possible point within the data set. The boundaries are based on the data and the data type must be quantitative. Examples include continuous temperature or rainfall over a country because any given point within that country will have a temperature or amount of rainfall.
Dot Density Map
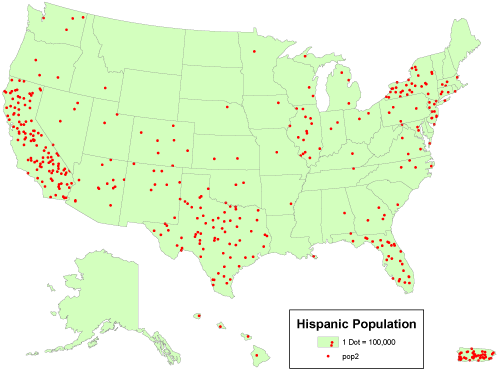
A dot density map is a quantitative, thematic map on which dots of the same size are randomly placed in proportion to a numeric attribute associated with an area. Dot density maps convey the intensity of an attribute. Examples of dot density maps include the distribution of car dealerships in Belgium (1 dot = 1 dealership) or earthquake epicenters across the Pacific for the past 10 years (1 dot = 1 epicenter).
Proportional Symbol Map

Proportional symbol maps scale the size of simple symbols (usually a circle or square) proportionally to the data value found at that location The larger the symbol, the "more" of something exists at a location. Examples include liters of coffee consumed per capita in 2010 by country or the location and magnitude of earthquakes in California 1900-2010.
No comments:
Post a Comment